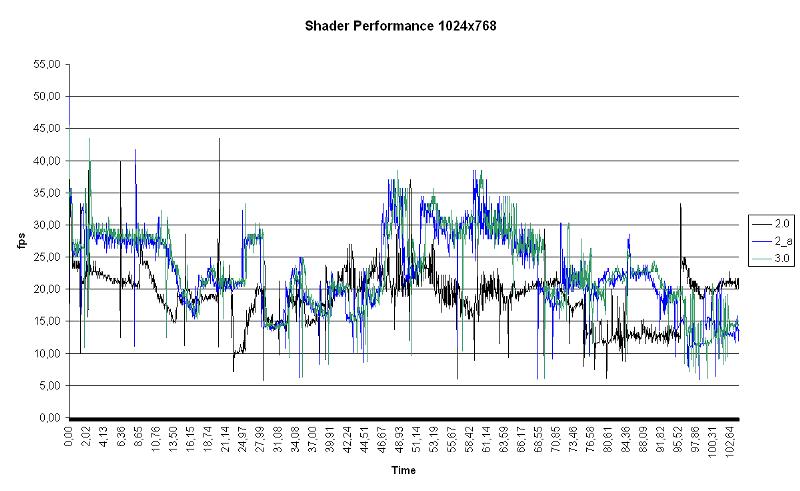
You will observe that path 2.0 is easily
the slowest. On the other hand, performance between 2_a and 3.0 is more
difficult to distinguish, there is no real winner between the two.
AA Comparison
In this chart, I compare the basic shader paths to the 2_a path with anti-aliasing in order to see what impact there is (click image to enlarge) :
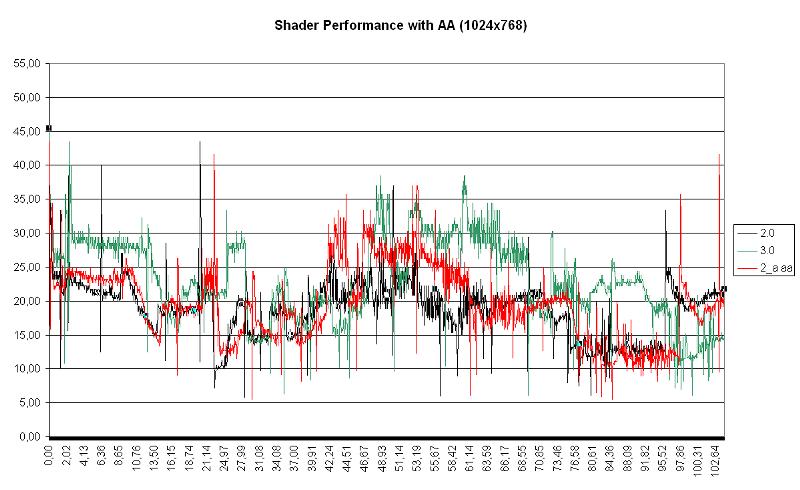
In this chart, it is obvious that the
2_a path with AA is drawn down to the level at which the 2.0 performs
without AA.
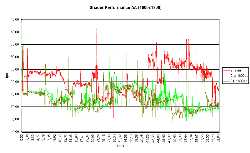
Hi-Definition AA Comparison
In this chart, I assemble the data from the same comparisons done at 1600x1200 :

As you can see, the 2_a and 3.0 paths cannot get themselves to compare favorably with the 2_a path at 1024x768. The increase in number of pixels overcomes the increase in rendering by a significant amount.